

🏡 Boise–Meridian Real Estate Snapshot (June 2025)
🏷️ Median Home Prices:
- Boise: $504,848 (↑ 1.9% YoY)
- Meridian: $588,146 (↑ 11% YoY)
📦 Inventory Trends:
- Boise: Inventory nearly doubled YoY (+96.4%) — easing competition.
- Meridian: ~1,340 homes on market — more options for buyers.
⏳ Days on Market:
- Boise: 34–38 days on average.
- Meridian: 32 days (↓ from 39 days YoY)
📍 Hot Neighborhoods:
- Boise: North End, Southeast Boise, West Bench
- Meridian: Settlers Bridge, Settlers Lane (near Settlers Park)
🛠️ New Construction:
- Builders offering incentives (rate buydowns, upgrades).
- New builds gaining buyer attention in both counties.
💼 For Buyers:
- More choices, slower price growth.
- Less competition than 2021–2022.
💰 For Investors:
- Boise poised for long-term appreciation.
- Rental demand is strong due to steady in-migration.
Ada County Real Estate Market Update – May 2025 (Single-Family Homes)
Published by: Boise Regional REALTORS®
Data Source: Intermountain MLS (as of June 10, 2025)

🔑 Ada County Real Estate Market Update (Single-Family Homes): Key Metrics (May 2025 vs May 2024)
| Metric | May 2024 | May 2025 | % Change |
| Closed Sales | 809 | 835 | +3.2% |
| Median Sales Price | $559,839 | $579,900 | +3.6% |
| Days on Market | 38 | 34 | -10.5% |
| Pending Sales | 1,173 | 1,303 | +11.1% |
| Inventory (Homes for Sale) | 1,629 | 2,121 | +30.2% |
| Months Supply of Inventory | 2.6 | 3.0 | +15.1% |
📈 Year-to-Date Comparison
| Metric | YTD 2024 | YTD 2025 | % Change |
| Closed Sales | 3,206 | 3,360 | +4.8% |
| Median Sales Price | $544,994 | $552,508 | +1.4% |
| Days on Market | 44 | 44 | 0.0% |
📉 Market Trends (Historical Highlights)
✅ Closed Sales
- May 2025: 835 homes sold
- High: 1,402 (July 2020)
- Low: 235 (January 2009)
✅ Median Sales Price
- May 2025: $579,900
- High: $602,250 (April 2022)
- Low: $133,000 (April 2011)
✅ Inventory of Homes for Sale
- May 2025: 2,121 active listings
- High: 5,198 (July 2007)
- Low: 269 (January 2021)
📌 Key Takeaways
- Market Activity: Slight increase in closed and pending sales year-over-year, indicating strong buyer engagement.
- Pricing Trends: Median prices remain strong and are trending upward with a 3.6% increase YoY.
- Inventory Growth: Active listings increased by over 30%, suggesting improved selection for buyers and reduced urgency.
- Days on Market: Homes are selling faster than last year, averaging just over a month.
Ada County New Construction Real Estate Market Update – May 2025
Published by Boise Regional REALTORS® | Data from Intermountain MLS as of June 10, 2025

📊 Ada County New Construction Real Estate Market Update: Key Market Metrics May 2025
| Metric | May 2024 | May 2025 | % Change | YTD 2024 | YTD 2025 | % Change |
| Closed Sales | 250 | 270 | +8.0% | 1,195 | 1,269 | +6.2% |
| Median Sales Price | $581,992 | $573,990 | -1.4% | $569,800 | $574,990 | +0.9% |
| Days on Market | 70 | 56 | -20.0% | 66 | 61 | -7.6% |
| Pending Sales | 680 | 669 | -1.6% | — | — | — |
| Inventory | 655 | 939 | +43.4% | — | — | — |
| Months Supply | 3.2 | 3.7 | +17.7% | — | — | — |
📈 Historical Graph Summaries
Closed Sales
- High: 508 (August 2005)
- Low: 32 (January 2010)
- Current (May 2025): 270
Median Sales Price
- High: $690,000 (June 2022)
- Low: $147,390 (October 2009)
- Current (May 2025): $573,990
Inventory of Homes for Sale
- High: 1,894 (September 2006)
- Low: 135 (February 2021)
- Current (May 2025): 939
🔍 Key Insights
- Market Activity: Closed sales for new construction homes in Ada County rose by 8% YoY, indicating resilient demand despite affordability concerns.
- Prices Softening Slightly: Median sales price declined by 1.4% YoY, though year-to-date figures show a slight recovery (+0.9%).
- Faster Market Turnaround: Days on market dropped sharply by 20%, suggesting faster decision-making and possibly competitive buyer behavior.
- Inventory Surge: Active listings are up by 43.4%, contributing to a 17.7% increase in months of inventory (3.7 months), giving buyers more options and balancing pressure on prices.
*These statistics are based on data from the Intermountain MLS, reported by member agents of Boise Regional REALTORS®. Figures are subject to verification and may be revised. Inventory and months supply are manually calculated. Historical charts begin in 2007 unless otherwise noted.
Ada County Housing Market Data – Existing/Resale (May 2025)
Source: Boise Regional REALTORS®
Data Date: June 10, 2025 (via Intermountain MLS)

📊 Ada County Housing Market Data – Existing/Resale: Key Metrics: May 2025 vs May 2024
| Metric | May 2024 | May 2025 | % Change |
| Closed Sales | 559 | 565 | +1.1% |
| Median Sales Price | $540,000 | $585,000 | +8.3% |
| Days on Market | 24 | 23 | -4.2% |
| Pending Sales | 493 | 634 | +28.6% |
| Inventory | 974 | 1,182 | +21.4% |
| Months Supply of Inventory | 2.3 | 2.6 | +11.4% |
📈 Year-To-Date (YTD) Comparison
| Metric | YTD 2024 | YTD 2025 | % Change |
| Closed Sales | 2,011 | 2,091 | +4.0% |
| Median Sales Price | $525,000 | $540,000 | +2.9% |
🔹 Historical Insights
- Closed Sales:
- All-time high: 966 (July 2020)
- All-time low: 186 (January 2009)
- Current (May 2025): 565
- Median Sales Price:
- Peak: $586,750 (May 2022)
- Low: $126,500 (January 2011)
- Current: $585,000
- Inventory of Homes for Sale:
- High: 3,935 (July 2007)
- Low: 103 (January 2021)
- Current: 1,182
📝 Summary
The Ada County real estate market showed modest growth in May 2025, with closed sales up slightly (+1.1%) and a significant rise in pending sales (+28.6%), indicating strong buyer activity. Median home prices rose year-over-year by 8.3%, nearing the record set in 2022. Inventory and supply also increased, offering slightly more options for buyers.
This data reflects a stabilizing yet active market, with strong demand, limited supply, and rising prices—consistent with a recovering regional housing trend.
For detailed methodology and real-time updates, visit: boirealtors.com/notes-on-data-sources-and-methodology
Real Estate Market Update – May 2025 (Canyon County)

Canyon County, ID Housing Market Update – May 2025 (Single-Family Homes)
Source: Boise Regional REALTORS® (Data from Intermountain MLS, as of June 10, 2025)
📊 Canyon County, ID Housing Market Update (Single-Family Homes) : Key Market Metrics
| Metric | May 2024 | May 2025 | % Change | YTD 2024 | YTD 2025 | YTD % Change |
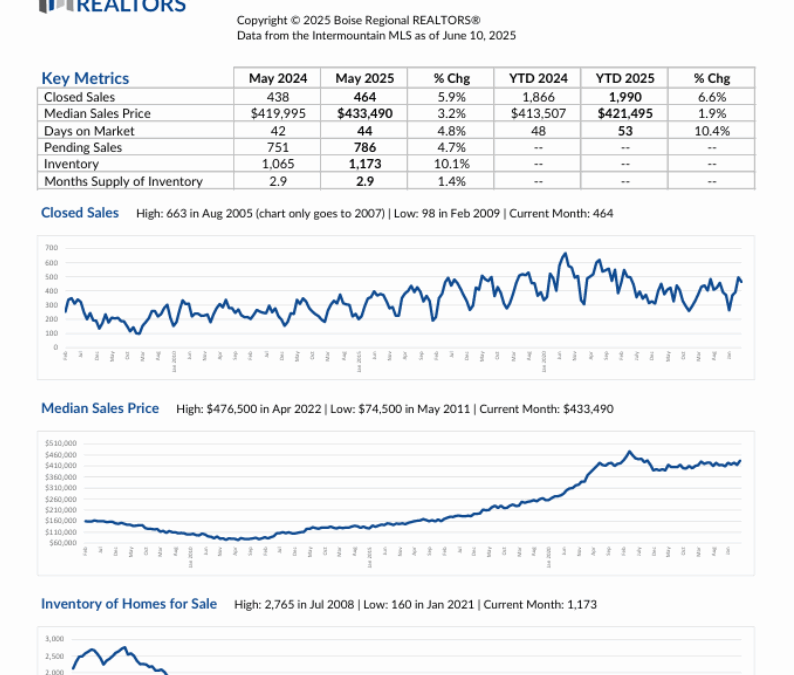
| Closed Sales | 438 | 464 | +5.9% | 1,866 | 1,990 | +6.6% |
| Median Sales Price | $419,995 | $433,490 | +3.2% | $413,507 | $421,495 | +1.9% |
| Days on Market | 42 | 44 | +4.8% | 48 | 53 | +10.4% |
| Pending Sales | 751 | 786 | +4.7% | — | — | — |
| Inventory | 1,065 | 1,173 | +10.1% | — | — | — |
| Months Supply of Inventory | 2.9 | 2.9 | +1.4% | — | — | — |
📈 Market Trends Overview
🔹 Closed Sales
- May 2025: 464
- Highest (since 2007): 663 (Aug 2005)
- Lowest: 98 (Feb 2009)
🔹 Median Sales Price
- Current (May 2025): $433,490
- All-Time High: $476,500 (Apr 2022)
- All-Time Low: $74,500 (May 2011)
🔹 Inventory of Homes for Sale
- Current Inventory (May 2025): 1,173
- Historical High: 2,765 (Jul 2008)
- Historical Low: 160 (Jan 2021)
🔍 Insights & Interpretation
- Moderate Sales Growth: Closed sales are up 5.9% YoY, showing increasing buyer activity despite slightly longer days on market.
- Rising Prices: The median sales price has climbed to $433,490, a 3.2% increase YoY, reflecting steady demand and market confidence.
- More Inventory: Inventory grew 10.1% YoY, giving buyers more options and possibly balancing the market.
- Stable Supply: The month’s supply of inventory remained flat at 2.9, suggesting continued seller leverage but trending toward a more balanced market.
🏠 What This Means for Buyers and Sellers
- Buyers: Expect more choices on the market, but be prepared for modest price increases and competitive conditions.
- Sellers: Still a strong market to list, with upward pricing pressure and steady demand, especially for well-maintained and competitively priced homes.
For detailed analysis or to access the original data, visit: boirealtors.com or intermountainmls.com
Canyon County Real Estate Market Report – May 2025 (Existing/Resale)
Published by Boise Regional REALTORS®
Data as of June 10, 2025 | Source: Intermountain MLS
 - Good News Realty Group")
🗝️ Canyon County Real Estate Market (Existing/Resale) : Key Housing Market Metrics – May 2025
| Metric | May 2024 | May 2025 | % Change |
| Closed Sales | 267 | 254 | -4.9% |
| Median Sales Price | $400,000 | $410,000 | +2.5% |
| Days on Market | 28 | 33 | +17.9% |
| Pending Sales | 259 | 317 | +22.4% |
| Inventory | 571 | 614 | +7.5% |
| Months Supply of Inventory | 2.9 | 2.8 | -3.5% |
Year-To-Date (YTD) Comparisons
| Metric | YTD 2024 | YTD 2025 | % Change |
| Closed Sales | 957 | 1,024 | +7.0% |
| Median Sales Price | $393,000 | $398,000 | +1.3% |
| Days on Market | 35 | 40 | +14.3% |
📈 Market Trends Overview
🔵 Closed Sales
- May 2025 Total: 254
- Peak: 473 (August 2005)
- Lowest: 81 (November 2008)
💵 Median Sales Price
- May 2025 Price: $410,000
- Peak: $425,000 (May 2022)
- Lowest: $72,250 (May 2011)
🏠 Inventory of Homes for Sale
- May 2025 Inventory: 614
- Peak: 2,149 (July 2008)
- Lowest: 76 (December 2020)
*All statistics are based on verified data from the Intermountain MLS (IMLS) and Boise Regional REALTORS®. These metrics reflect resale/existing home transactions in Canyon County and are intended for general market insight. Months Supply of Inventory is manually calculated. Market conditions can fluctuate and are not guaranteed predictors of future trends.
Boise Regional REALTORS®
IMLS Agent Search Tool
Canyon County, Idaho – New Construction Housing Market Report (May 2025)
Published by: Boise Regional REALTORS®
Data Source: Intermountain MLS (as of June 10, 2025)
 - Good News Realty Group")
📊 Canyon County, Idaho – New Construction Housing Market : Key Housing Market Metrics – May 2025
| Metric | May 2024 | May 2025 | % Change |
| Closed Sales | 171 | 210 | +22.8% |
| Median Sales Price | $437,883 | $450,000 | +2.8% |
| Days on Market | 64 | 58 | -9.4% |
| Pending Sales | 492 | 469 | -4.7% |
| Inventory (Homes for Sale) | 494 | 559 | +13.2% |
| Months Supply of Inventory | 3.0 | 2.9 | -1.2% |
Year-To-Date (YTD) Performance
| Metric | YTD 2024 | YTD 2025 | % Change |
| Closed Sales | 909 | 966 | +6.3% |
| Median Sales Price | $430,000 | $444,843 | +3.5% |
| Days on Market | 61 | 67 | +9.8% |
📈 Market Trends & Graph Insights
🔹 Closed Sales Trend
- High: 258 in July 2020
- Low: 4 in September 2010
- Current (May 2025): 210
🔹 Median Sales Price History
- High: $549,000 (April 2022)
- Low: $113,995 (January 2012)
- Current: $450,000
🔹 Inventory of Homes for Sale
- High: 854 (January 2007)
- Low: 70 (September 2020)
- Current Inventory: 559 homes
🔍 Insights & Takeaways
- Market Activity: Strong increase in closed sales YoY, indicating growing buyer confidence and transaction volume in new construction.
- Price Growth: Steady appreciation in home values (+2.8% monthly, +3.5% YTD), signaling a healthy but competitive market.
- Inventory Trends: Rising inventory offers more choices to buyers, yet a slight decrease in months supply suggests continued demand.
- Days on Market: Homes are selling faster than last year, decreasing from 64 to 58 days—a 9.4% improvement in market velocity.
FHL Daily Mortgage Rates – June 17, 2025
Stay up to date with the latest local mortgage rates provided by Fulcrum Home Loans. Here are today’s rates based on typical loan scenarios:
🔹 Conventional Loan Rates
| Points | Rate | APR |
| 1-Point | 6.500% | 6.700% |
| No Points | 6.875% | 6.973% |
Parameters: 30-Year Fixed, 780 FICO, 5% Down Payment, Owner-Occupied, Single-Family Residence
🔹 FHA Loan Rates
| Points | Rate | APR |
| 1-Point | 5.990% | 6.874% |
| No Points | 6.125% | 6.948% |
Parameters: 30-Year Fixed, 780 FICO, 3.5% Down Payment, Owner-Occupied, Single-Family Residence
🔹 VA Loan Rates
| Points | Rate | APR |
| 1-Point | 5.990% | 6.373% |
| No Points | 6.250% | 6.540% |
Parameters: 30-Year Fixed, 780 FICO, 0% Down Payment, Owner-Occupied, Single-Family Residence
📌 Important Notes
APR (Annual Percentage Rate) reflects the true cost of the loan, including interest rate and fees.
🔔 Disclaimer: Actual rate, payment, and costs may vary. Always request an official loan estimate before making a decision.
Provided by: Fulcrum Home Loans
NMLS #1926444
Local Real Estate News
1. Boise’s Housing Market Cools Slightly — But Demand Remains Strong
Boise’s median home price dipped slightly to around $596,580, with an average of 12 days on the market. The market is shifting from a seller’s stronghold to a more balanced state.Source: Rocket Homes – Boise Market Report

🏗️ 2. Pivot Pointe Breaks Ground in Meridian
A major new development in Meridian, Pivot Pointe offers homes starting around $380,000 with community features like parks and walking paths—targeting entry-level and move-up buyers.
Source: Idaho Business Review – Pivot Pointe Article

🏢 3. The Arthur Tower Opens: Idaho’s Tallest Residential Skyscraper
Downtown Boise just got a luxury lift—The Arthur, now Idaho’s tallest residential building, recently opened with high-end amenities and skyline views.
Source: Wikipedia – The Arthur

Welcome Joshua Krohn to the Good News Realty Group Team!
-2 - Good News Realty Group")
We’re excited to welcome Joshua Krohn as our new Chief of Staff at Good News Realty Group!
Joshua brings over 15 years of experience in administrative leadership, including roles in operations, executive support, and team management. His deep background in executive administration, project management, and client engagement makes him a vital asset to our mission of delivering exceptional service.
Originally from the Treasure Valley, Joshua has called Boise home since 2003, where he lives with his wife and their four boys. In his role, he’ll be driving strategic alignment, coordinating marketing efforts, and ensuring team efficiency.
Outside the office, Joshua is a passionate drummer with 25 years of experience and enjoys staying active in the local community with his family.
Please join us in giving Joshua a warm welcome!
Ready to make the move to Boise, Idaho?

Whether you’re thinking of relocating, buying your first home, or just staying informed on the Idaho housing market, we’ve got everything you need to make confident moves.
🔍 Browse Homes for Sale in Idaho
📺 Latest Idaho Relocation Videos

Recent Comments